Comparative Market Analysis for February in Canada
Advertisement: Click here to learn how to Generate Art From Text
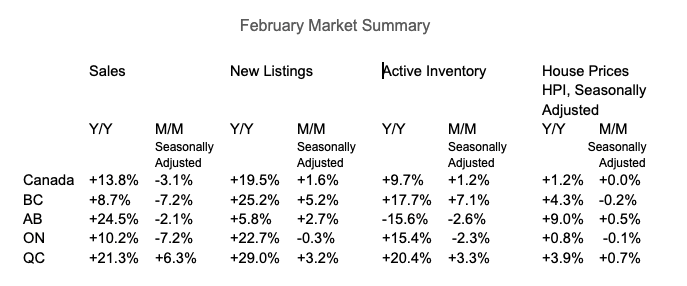
According to a report by Edge Realty, in February, the real estate markets of Canada’s provinces experienced a variety of trends, but Canada as a whole continued to face affordability issues.
Source: Edge Realty
Home Sales
In February, the demand for homes in Canada decreased significantly. Seasonally adjusted home sales fell by 3.1% from month to month (m/m) for the entire country. However, this decrease wasn’t experienced equally in all provinces, and some actually experienced increases.
The decline in British Columbia (BC), and Ontario was especially pronounced, with both experiencing a 7.2% monthly drop. Sales grew by nearly 14% over the past year (y/y), but Alberta was the leader with a 25% rise.


Source: Edge Realty
Listings
The supply side also experienced significant changes in February. New listings increased 1.6% m/m across the country. BC had the largest increase, a 5% surge. Listings are now 20% higher than 2023 levels. Different provinces experienced different results; Ontario saw a slight drop of 0.3% for new listings in the month.

Source: Edge Realty
Market balance dropped in February in most regions, with notable declines in the sale-to-new listings ratio in BC, which dropped to 44%, indicating a shift towards a buyer’s market. Atlantic Canada defied the trend by maintaining a stable balance in the market.

Source: Edge Realty
Surprisingly the active inventory at month’s end rose by 1.2%, or almost 10% year-over-year. BC, with its 7.1% increase, was the main cause of this rise. Ontario and Alberta, on the other hand, experienced declines. Alberta saw inventory levels drop to less than half what they were from 2018 to 2019.


Source: Edge Realty
While the MLS House Price Index reported that national house prices were flat in February, the prairie provinces saw a continued upward trend. The index flattened after five consecutive months of declines. Both the 1-month and 3-month changes highlight the prairies’ positive performance, contrasting with the declines in major Ontario metros.


Source: Edge Realty
Nationally, the house prices in February were 14% below their peak, which translates into a real, adjusted for inflation, decline of 22%. This shows the importance of the real estate correction, even if the severity varies across regions.

Source: Edge Realty
The affordability challenge persists despite the February trends. The monthly payment needed to buy a typical Canadian home at 80% loan-to value ratio dropped to $3,250 in Feburary, down $18 compared to the previous month, and nearly 9% below the peak in September of 2023.
Affordability is a major issue in Canada, except for the prairies and Atlantic Canada.

‘ Credit:
Original content by www.canadianrealestatemagazine.ca – “February Market Comparison Across Canada”
Read the complete article at https://www.canadianrealestatemagazine.ca/news/canada-re-market-trendfeb-24/