Housing Trends in May across Canada
Advertisement: Click here to learn how to Generate Art From Text
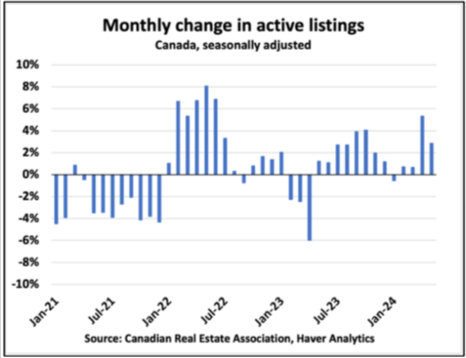
According to a new report from Edge Realty Analytics, housing inventory increased in May, continuing a trend that began in previous months. Seasonally adjusted levels of active inventory rose 2.9% from month to month (m/m), while Ontario saw a 5.5% increase. Ontario listings are now 70% more than they were at the same time last season. It is important to note, however, that despite this increase, national inventory levels are still not back to what would be considered “normal” levels.
Real Estate Market Trends Across Canada
Canada
On a local level, Canadian real estateSales have decreased by 6.4% y/y and by 0.6% month-to-month. New listings however increased by a modest 15.6% y/y, and by 0.5% m/m. Active inventory increased by 30,0% y/y, and 2.9% m/m. This indicates a significant build-up of properties. Despite the rise in inventory, the Housing Price Index (HPI), which is seasonally adjusted and measures house prices, showed a slight growth of 1.1% y/y, but a minor decrease of 0.2% m/m.
British Columbia
In BC, sales dropped by 14.5% over the past year but showed a slight increase with a 1.9% m/m. New listings in BC grew by 11.7% y/y, but declined by 4.0% m/m. This indicates a mixed trend. Active inventory in BC increased by 42.6% over the past year and by 2.4% on a monthly basis. House prices in the province increased by 4.4% y/y, but decreased by 0.1% m/m.
Alberta
Alberta had a very different picture. Sales increased by 6.7% y/y, and by 2.5% m/m. Alberta saw a 13.0% increase in new listings y/y, and a significant m/m rise of 8.0%. Despite this, Alberta’s active inventory declined by 11.7% year-over-year but increased slightly by 1.3% month-overmonth. Alberta house prices increased by 9.9% y/y, and 0.7% m/m.
Ontario
Ontario sales dropped by 17.1% year-over-year and 2.0% month-overmonth. New listings, on the other hand, increased by 21,2% y/y, and 1.6% m/m. Active inventory in Ontario increased by 70.5% over the past year and 5.5% over the last month, indicating a significant increase of available properties. The price of houses in Ontario has remained relatively steady despite the increase in available inventory. It showed a slight rise of 0.5% year-over-year but a small drop of 0.1% month-overmonth.
Quebec
Quebec showed a variety of trends, with sales increasing by 5,4% y/y and declining by 2,4% m/m. New listings in Quebec increased by 16.5% year-over-year, but experienced a slight decline of 0.5% month-overmonth. Active inventory increased by 23.9% over the past year and 2.8% over the last month in Quebec. House prices in Quebec rose as well, with a 4.9% y/y increase and a 0.4% m/m increase.

Regional Diversity
There are distinct regional trends in the Canadian real estate market, with significant differences in sales and listings, inventory and prices between provinces. While some areas are experiencing substantial increases in listings and inventories, others are experiencing moderate changes.
Inventory
The increase in Housing inventoryThe distribution of inventory across Canada is not uniform, and there are large regional differences. While Ontario is experiencing an increase in inventory levels, it is being offset by continued decreases in provinces like Alberta and Saskatchewan, as well regions within Atlantic Canada. This highlights the regional nature of Canada’s real estate market, making it clear that referring to a “Canadian”The housing market is often overgeneralized. The Canadian housing market is a better alternative. Housing landscapeThe world market should be viewed as a collection or regional markets with unique dynamics and trends.


New Listings
In May, new listings nationwide increased by 0.5% m/m and 13.5% y/y. Despite the gains, the rolling 12-month total of new listings is still significantly below normal. Previously, the supply was kept off the market. This trend is changing. We can expect a steady flow of new listings for the remainder of the calendar year.

Source: Edge Realty Analytics
Sales
On the demand front, this spring continues its disappointment. Seasonally adjusted national home sales fell 0.6% month-overmonth (m/m), in May. This was driven by a decline of 2.0% in Ontario, and a drop of 2.4% in Quebec. Alberta, on the other hand, saw a 2.5% rise in sales.
Ontario, where home sales are down 17% y/y and remain 30% below average for the last decade, is a particular weak spot.


Source: Edge Realty Analytics
Months of Inventory
Months of inventory have risen to their highest level since 2020, as supply has increased and demand has decreased. However, there are still regional differences. For example, between Alberta and Ontario.

Prices
Toronto was the main culprit for the 0.2% decline in seasonally adjusted house prices month-over-month in May. Alberta, on the other hand, saw a 0.8% rise in house prices during last month.
To put the national decline in context, the change in prices in several major metropolitan areas when adjusted for season shows that the downward pressure in three markets is the main cause of the reported decline. Eight other major markets also saw significant monthly increases in May.
In terms of the overall trend, house prices are still 14% below their peak level in the country and 23% lower when adjusted for inflation.


Affordability
Assuming 20% down payment, and a 30-year amortization period, a buyer of a typical home in today’s market would be faced with a monthly mortgage repayment of $3,185. While this figure isn’t as good compared to the levels of 2021, it is now trending positively.


‘ Credit:
Original content by www.canadianrealestatemagazine.ca – “Across Canada: Housing Trends In May”
Read the complete article at https://www.canadianrealestatemagazine.ca/news/across-canada-housing-trends-may-2024/