March 2024 Greater Vancouver Realtors Statistics
Advertisement: Click here to learn how to Generate Art From Text
Increased seller activity is giving buyers more choice this Spring – March 2024 Greater Vancouver Realtors Statistics
VANCOUVER, BC – April 3, 2024 – You can also find out more about the following: number of Metro Vancouver1 homes listed for sale on the MLS® rose nearly 23 per cent year-over-year, providing more opportunity for buyers looking for a home this spring.
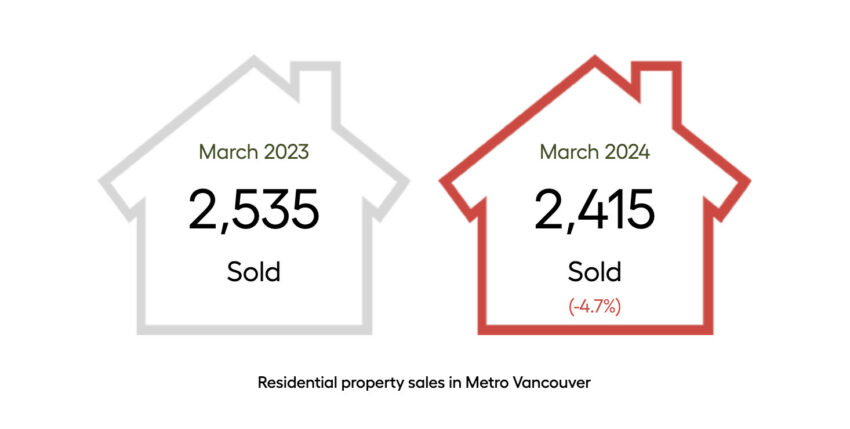
The Greater Vancouver REALTORS® (GVR)Reports state that residential sales totaled 2,415 in the region in March of 2024. That’s a decrease of 4.7 percent from the 2,535 recorded sales in March of 2023. This was 31.2% below the seasonal average of 3 512 over the past 10 years.
“If you’re finding the weather a little chillier than last spring, you may find some comfort in knowing that the market isn’t quite as hot as it was last spring either, particularly if you’re a buyer,” Andrew Lis, GVR’s director of economics and data analytics said. “Despite the welcome increase in inventory, the overall market balance continues inching deeper into sellers’ market territory, which suggests demand remains strong for well-priced and well located properties.”
There were 5,002 detached, attached and apartment properties newly listed for sale on the Multiple Listing Service® (MLS®) in Metro Vancouver in March 2024. This represents an increase of 15.9 percent compared to the 4 317 properties listed in march 2023. This was 9.5% below the 10-year average seasonal sales (5,524).
The total number of properties currently listed for sale on the MLS® system in Metro Vancouver is 10,552, a 22.5 per cent increase compared to March 2023 (8,617). This is 6.3 percent above the seasonal 10-year average (9,923).
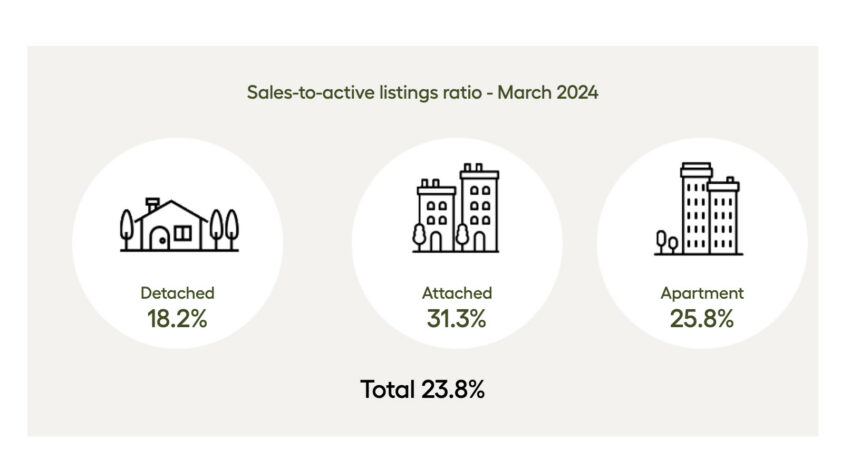
For all detached, apartment and attached property types in March 2024, the ratio of sales to active listings is 23,8%. According to property type, the sales-to-active listings ratio for March 2024 is 23,8% for detached homes.
According to historical data, the ratio can cause downward pressure on the price of a home if it dips below 12% for a prolonged period. On the other hand, the ratio can also cause upward pressure if it exceeds 20% over a number of months.
“Even though the market isn’t quite as hot as it was last year, we’re still seeing modest month-over-month price gains of one to two per cent happening at the aggregate level, which is an interesting dynamic given that borrowing costs remain elevated,” Lis said. “With the latest inflation numbers trending in the right direction, it remains likely that we’ll see at least one or two modest cuts to the Bank of Canada’s policy rate in 2024, but even if these cuts come, they may not provide the boost to affordability many had been hoping for. As a result, we expect constrained borrowing power to remain a challenging headwind as we move into the summer months.”
The MLS® Home Price Index composite benchmark price for all residential properties in Metro Vancouver is currently $1,196,800. This represents an increase of 4.5 percent over March 2023. It also represents a rise of 1.1 percent compared to February 2020.
In March 2024, the number of detached home sales fell to 694. This is a 5.4% decrease from March 2023 when 734 detached homes were sold. The benchmark price of a detached house is $2,007 900. This represents an increase of 7.4 per cent from March 2023.
In March 2024, apartment home sales reached 1,207. This is a 7.9 percent decrease from the 1,311 units sold in March 2023. The benchmark price for an apartment home is $777.500. This represents an increase of 5.7 percent from March 2023. It also represents a rise of 0.9 percent compared to February 2020.
Attached home sales reached 495 in March 2024. This represents a 6.2% rise compared to March 2023’s 466 sales. The benchmark price for a townhouse in 2024 is
1. The Real Estate Board of Greater Vancouver includes Burnaby, Coquitlam and Maple Ridge as well as New Westminster, North Vancouver. Port Coquitlam Port Moody Richmond South Delta Squamish Sunshine Coast Vancouver West Vancouver Whistler.

‘ Credit:
Original content by http://www.mikestewart.ca/ – “March 20,24 Greater Vancouver Realtors Statistics”.
Read the complete article at https://www.mikestewart.ca/march-2024-greater-vancouver-realtors-statistics/