May 2024 Greater Vancouver Realtors Statistics
Advertisement: Click here to learn how to Generate Art From Text
Metro Vancouver home sales down in May while inventory continues to increase – May 2024 Greater Vancouver Realtors Statistics
VANCOUVER, BC – June 4, 2024 – The number of transactions on the Multiple Listing Service® (MLS®) declined in May compared to what is typical for this time of year in Metro Vancouver. This shift has allowed the inventory of homes available for sale to continue to accumulate with over 13,000 homes now actively listed on the MLS® in the region.
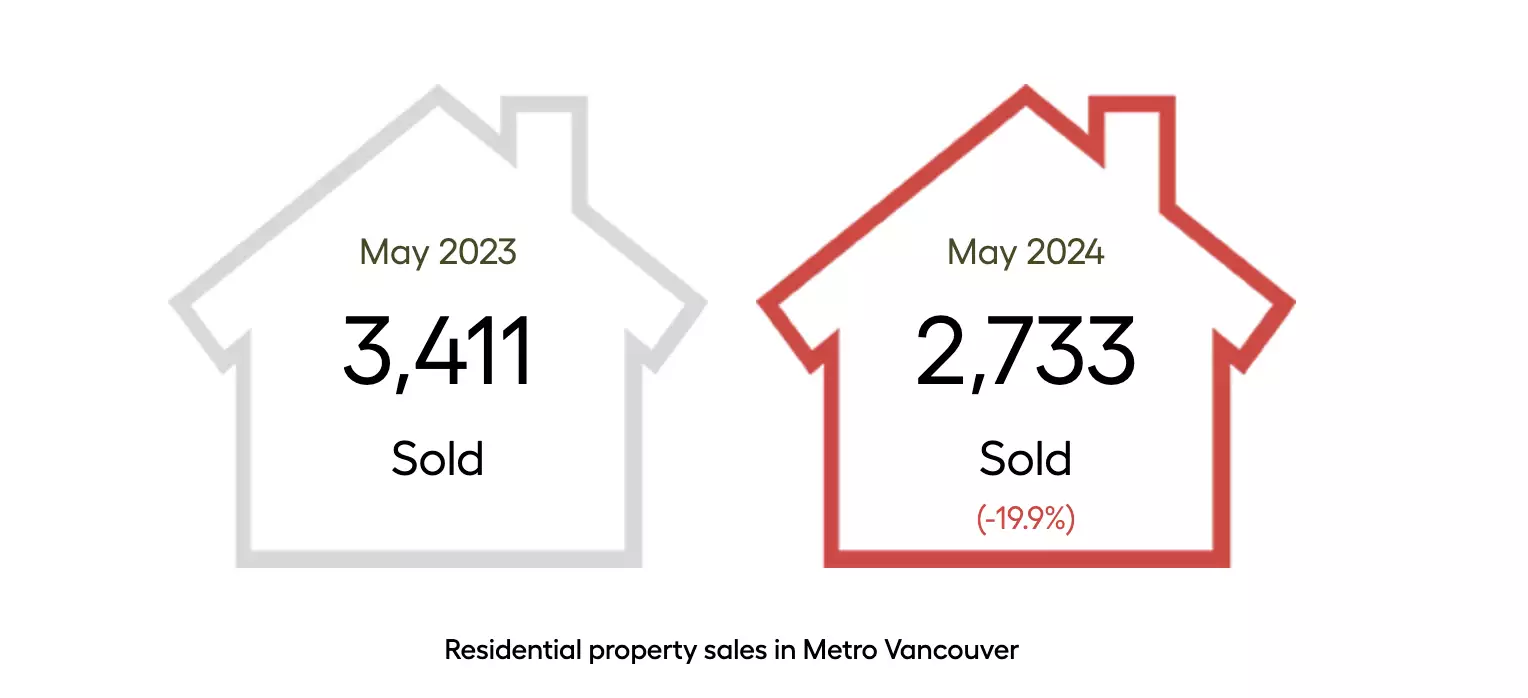
Greater Vancouver REALTORS® (GVR)Reports indicate that residential sales in the area totalled 2,733 units in May 2024. This is a 19.9% decrease from the 3,411 units sold in May 2023.
Last month’s sales total was also down 19.6 per cent from the 10-year seasonal average for May
(3,398).
“The surprise in the May data is that sales have come in softer than what we’d typically expect to see at this point in the year, while the number of newly listed homes for sale is carrying some of the momentum seen in the April data. It’s a natural inclination to chalk these trends up to one factor or another, but what we’re seeing is a culmination of factors influencing buyer and seller decisions in the market right now. It’s everything from higher borrowing costs, to worries about the economy, to policy interventions imposed by various levels of government.”
Andrew Lis is the director of REBGV’s economics and data analysis
There were 6,374 detached, attached and apartment properties newly listed for sale on the MLS® in Metro Vancouver in May 2024. This represents a 12.6% increase over the 5,661 listings in May 2023, and a 7.6% increase over the 10-year seasonal median (5,958).
The total number of properties currently listed for sale on the MLS® system in Metro Vancouver is 13,600, a 46.3 per cent increase compared to May 2023 (9,293). This total also represents a 19.9 percent increase over the 10-year seasonal mean (11,344).
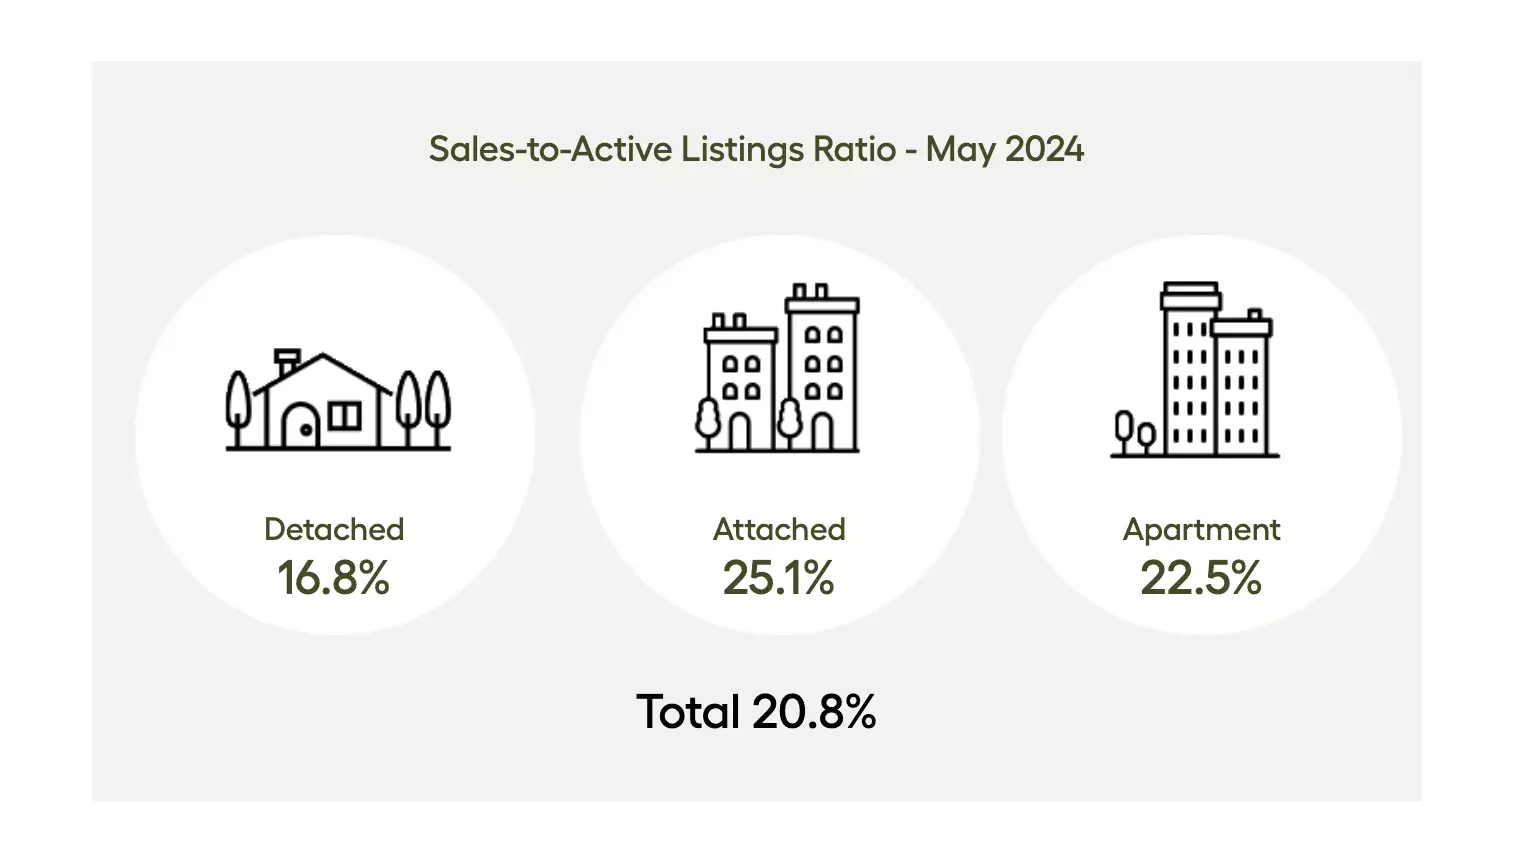
The sales-to-active-listings ratio for all types of detached, attached, and apartment properties in May 2024 was 20,8 per cent. The ratio varies by property type: 16.8% for detached homes, 25.1% for attached properties, and 22.5% for apartment properties.
According to historical data, the ratio can cause downward pressure on the price of a home if it dips below 12 percent for an extended period. On the other hand, the ratio can also cause upward pressure if it exceeds 20 cents over a number of months.
“With market trends now tilting back toward more balanced conditions, as the number of new listings outpaces the number of sales, we should expect to see slower price growth over the coming months,” Lis said. “Up until recently, prices were climbing modestly across all market segments. But with rising inventory levels and softening demand, buyers who’ve been waiting for an opportunity might have more luck this summer, even if borrowing costs remain elevated.”
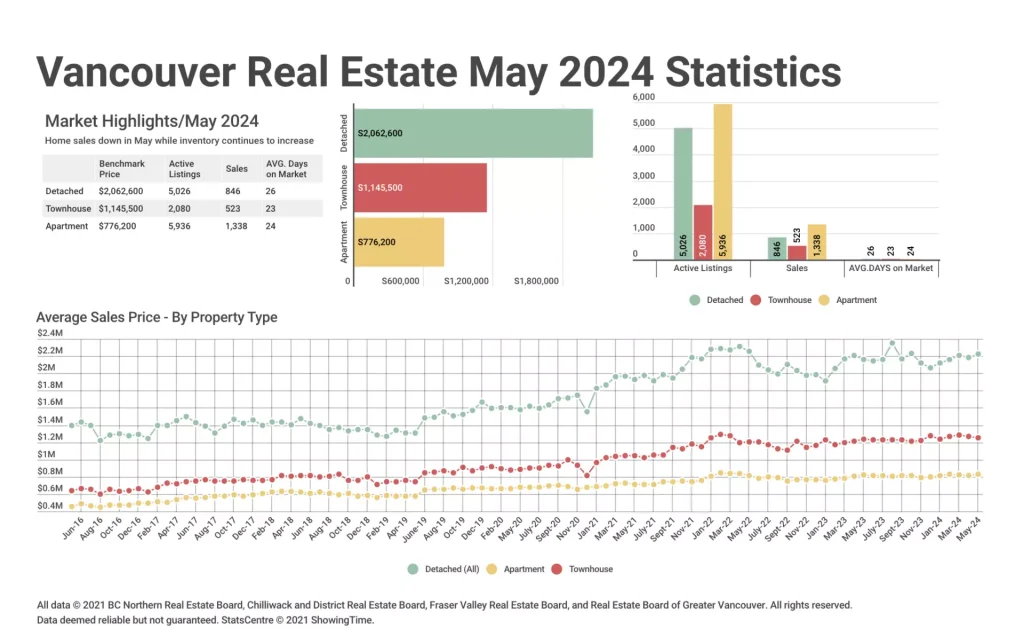
The MLS® Home Price Index (HPI) composite benchmark price for all residential properties in Metro Vancouver is currently $1,212,000. This represents an increase of 2.3 per cent over May 2023 as well as a 0.5 percent increase in comparison to April 2024.
In May 2024 the number of detached homes sold was 846. This is a decrease of 18.9% compared to the 1,043 detached homes that were sold in May 20,23. The benchmark price is $2.062,600 for a detached residence. This represents a 5.9 percent increase from May 2023, and a 1.3% increase compared to the month of April 2024.
In May 2024 the number of apartment homes sold fell to 1,338. That’s a 22.7% decrease from the 1,730 units sold in May. The benchmark apartment home price is $776.200. This represents an increase of 2.2 percent from May 2023. It also represents a decrease of 0.3 percent compared to April 2020.
In May 2024, the number of attached homes sold was 523. This is a decrease of 14 percent compared to 608 sales made in May 2023. The benchmark price for a townhouse in 2024 is $1,145.500. This represents an increase of 5.2 per cent from May 2023.
The Real Estate Board of Greater Vancouver covers the following areas: Burnaby Coquitlam Maple Ridge New Westminster North Vancouver Pitt Meadows Port Coquitlam Port Moody Richmond South Delta Squamish Sunshine Coast Vancouver West Vancouver and Whistler.

‘ Credit:
Original content by http://www.mikestewart.ca/ – “May 20,24 Greater Vancouver Realtors Statistics”.
Read the complete article at https://www.mikestewart.ca/may-2024-greater-vancouver-realtors-statistics/